1.1 Regional distribution pattern of China's environmental protection industry
1. China's environmental protection industry has initially formed the overall distribution characteristics of "one belt and one axis"
The regional development of China's environmental protection industry is extremely unbalanced. With its good economic strength, investment ability and foreign trade advantages, the eastern region has seized the opportunity and is in a leading position in high-end fields such as environmental protection technology research and development, environmental protection project design and consulting, and investment and financing services for environmental protection enterprises. Due to the weak economic foundation, resource and factor limitations, the development of the environmental protection industry in the central and western regions is lagging behind and slow, and basically staying in the development of the environmental protection equipment manufacturing industry. The output value of the environmental protection industry in the east accounts for more than 60% of the national output value, mainly concentrated in Jiangsu, Zhejiang, Shandong, Guangdong, Shanghai, Beijing, Tianjin and other provinces and cities, while the total output value of the environmental protection industry in the eight provinces and regions of Guangxi, Sichuan, Guizhou, Yunnan, Gansu, Qinghai, Xinjiang and Ningxia in the west is less than one-half of that of Jiangsu Province.
China's environmental protection industry has initially formed the overall distribution characteristics of the "Belt and Road Axis", that is, the "coastal development belt" of the environmental protection industry gathered and developed in the three core regions of the Bohai Rim, the Yangtze River Delta and the Pearl River Delta, and the "development axis along the river" of the environmental protection industry from Shanghai along the Yangtze River to Sichuan in the east.
2. Distribution of environmental protection enterprises
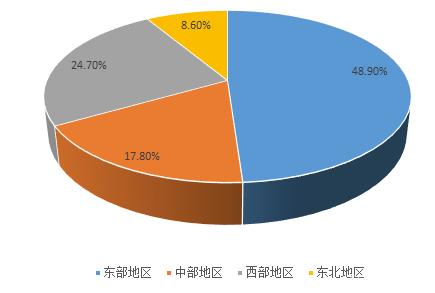
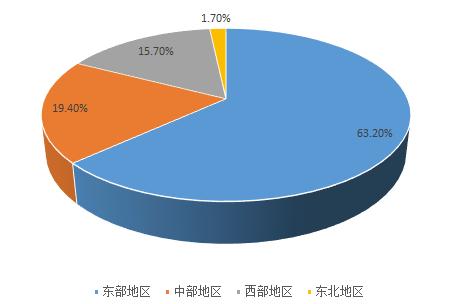
From the perspective of geographical distribution, the total number of enterprises in the central, western and northeastern regions accounts for slightly more than 50%. The operating income of enterprises in the eastern region accounted for more than 60%. The five provinces (cities) of Beijing, Hubei, Zhejiang, Guangdong and Jiangsu contributed nearly 63% of the country's revenue, of which Beijing contributed more than 21%.
Figure 33 Proportion of environmental protection enterprises in each region included in the statistics in 2018
Source: China Environmental Protection Industry Analysis Report (2019)
Figure 34 Proportion of operating income of environmental protection enterprises in each region included in the statistics in 2018
Source: China Environmental Protection Industry Analysis Report (2019)
1.2 Analysis of China's industrial environmental protection market demand
The dilemma of insufficient investment in industrial pollution control and low operating load rate of facilities is expected to be gradually solved in the future, and the inflection point of the industry has arrived, and the time has come for the full release of industrial environmental protection demand, and environmental protection enterprises that can provide better solutions will fully benefit.
The market demand is approaching the release node, and the industrial environmental protection explosion is full of momentum.
The past 10 years have been a decade of rapid explosion of investment in environmental protection in China, but the distribution of investment in environmental protection market segments is seriously unbalanced.
With the advancement of industrial capacity reduction and stricter environmental protection supervision, the industrial environmental protection market space has gradually opened. The market demand for industrial pollution control is great, and its market influence is no less than that of the municipal field.
In recent years, with the advancement of China's economic development and infrastructure construction, although the air pollution emission indicators of China's cement, thermal power and steel industries have reached the standards, the emission standards of coking, electrolytic aluminum and other industries are still 100-150mg/m3 and the current standards of developed countries in Europe and the United States are still a long way off.
1.3 Analysis of the scale of industrial sewage treatment in China
1. Number of sewage treatment plants
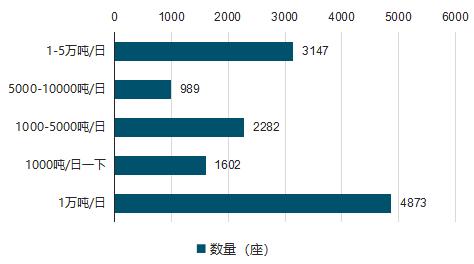
At the end of January 2020, a total of 10,113 sewage treatment plants across the country issued pollutant discharge permits, of which 9,873 sewage treatment plants announced the limit information on the total amount of pollutant discharge or discharge concentration, accounting for 97.6%. From the perspective of distribution by scale, 1-50,000 tons/day sewage treatment plants accounted for the largest proportion, reaching 3,147, accounting for 34.2%; a total of 989 5,000-10,000 tons/day, accounting for 10.7%; 2,282 1,000-5,000 tons/day, accounting for 24.8%; a total of 1,602 units below 1,000 tons/day, accounting for 17.4%; There are a total of 4,873 sewage treatment plants below 10,000 tons/day, accounting for 52.9%.
Figure 85 Number of sewage treatment plants in China in 2019
Data source: CIC Industry Research Institute
2. Sewage treatment capacity
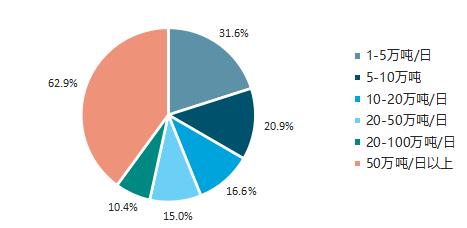
Figure 86 Distribution of production capacity of sewage treatment plants in China by scale in 2019 (daily production capacity)